lguayacan
Where do cost outliers come from?
| SQL analysis in BigQuery | Laura Camila Guayacan Ardila |
Question: which projects look unusually expensive per square foot, and why? Same 6,123-project dataset (Kaggle source) as the regression case study.
Result in four lines
- Not project type. Share flagged: Residential 7.4%, Commercial 6.8%, Industrial 6.5% (chi-square p about 0.56).
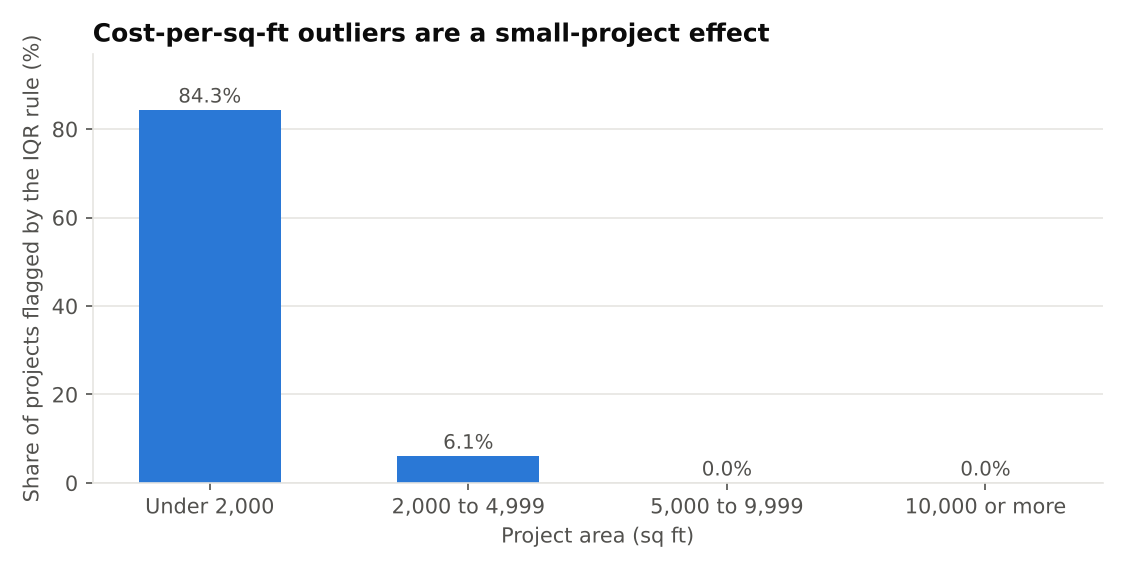
- Size. 84% of projects under 2,000 sq ft are flagged; above 5,000 sq ft, none.
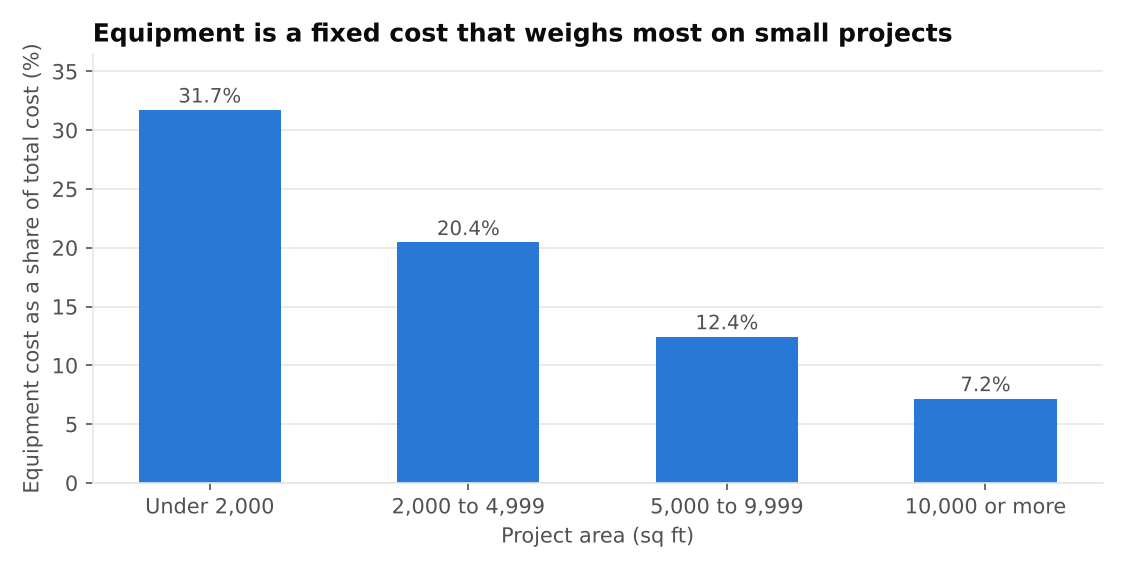
- Fixed cost. Equipment cost is about 100,000 USD in every size band, so it is 32% of cost on small projects and 7% on large ones. Removing it cuts the outliers by half (423 to 205).
-
Not weather or risk. Correlations with cost per sq ft are near zero ( r below 0.05).
Files: All SQL queries (10 queries, commented)
Cross-check: the IQR fences and the 423 flagged projects match the Google Sheets workbook exactly (upper fence 194.85 USD per sq ft).