What drives construction cost?
| Multiple regression on 6,123 construction projects |
Laura Camila Guayacan Ardila |
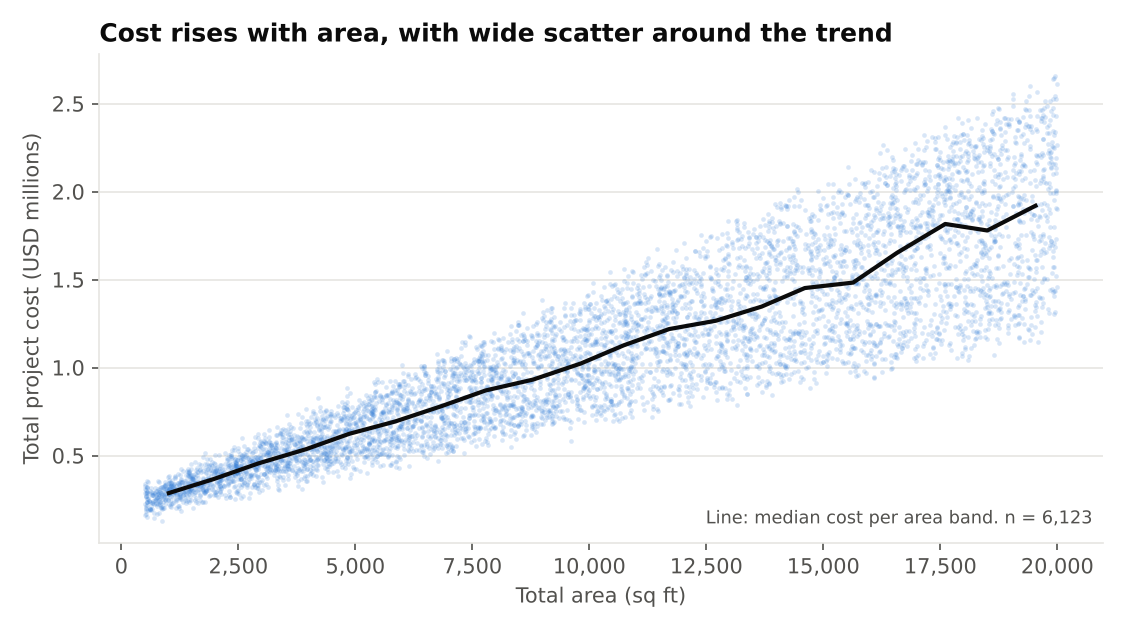
Question: which project factors explain total cost, and how reliably can a model predict it?
Result in four lines
- Area dominates. In the log-log model, +1% area is associated with about +0.66% cost (economies of scale).
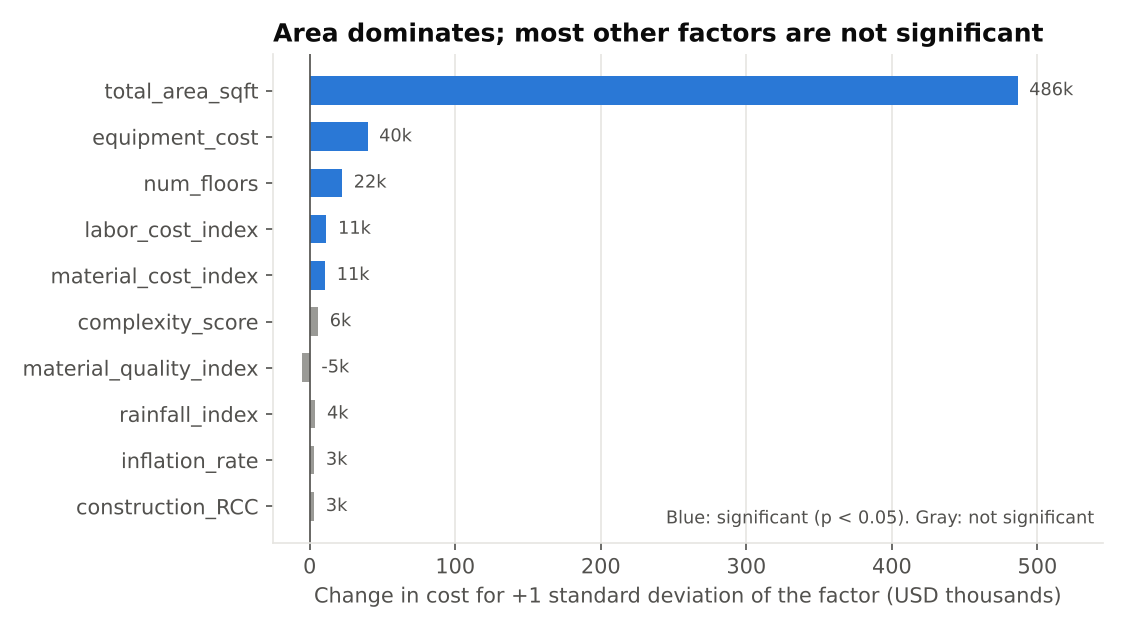
- Few other factors matter: equipment cost, floors, labor index and material index. Weather and risk do not.
- Fit: R-squared 0.81 (linear) and 0.87 (log-log); hold-out R-squared 0.80 and 0.86.
- Checked against Python
statsmodels: all 23 coefficients match to 4 decimals.
| |
Linear |
Log-log |
| R-squared |
0.81 |
0.87 |
| Hold-out MAPE (USD) |
16.5% |
18.2% |
| Max VIF |
1.35 |
1.35 |
Files: Workbook (Google Sheets, view only)
Method
- Ordinary least squares, two models: linear (USD) and log-log (area elasticity).
- Dummy variables with reference levels Commercial, Rural, Hybrid, Pile.
- Diagnostics: t and F tests, adjusted R-squared, VIF (multicollinearity), Breusch-Pagan (heteroscedasticity, present in both models and much smaller in log-log).
- Validation: 70/30 hold-out split. The log-log model back-transforms with a smearing factor.
- Excluded `cost_category` because it is derived from cost (leakage).
Data and limitations
- [Kaggle "Deep Learning Building Cost Dataset"](https://www.kaggle.com/datasets/colabsss/deep-learning-building-cost-dataset) (colabsss, CC0), 6,123 rows, 21 columns. It appears synthetic (nearly independent predictors), so results show method, not real market behaviour.
- `equipment_cost` is probably a cost component rather than a driver (see the [SQL case study](../sql-outliers/)).
- No actual-versus-planned costs. Correlation, not causation.